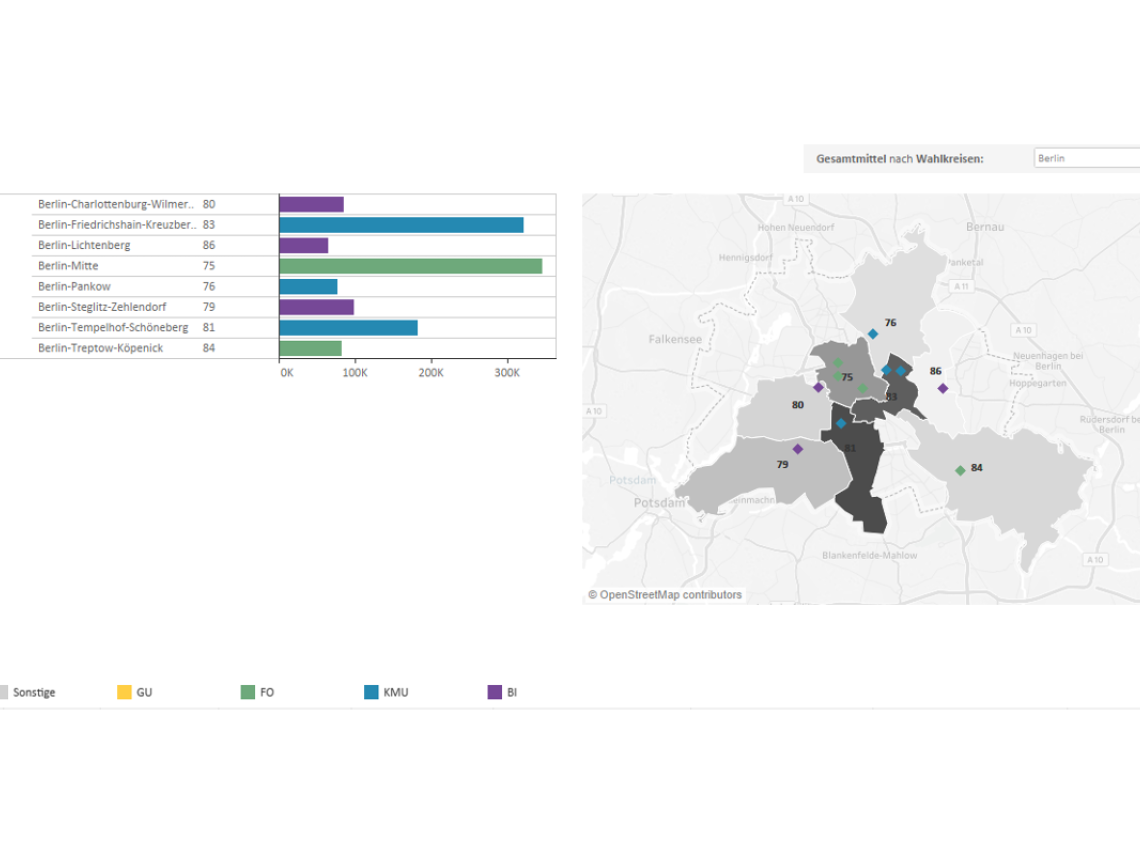
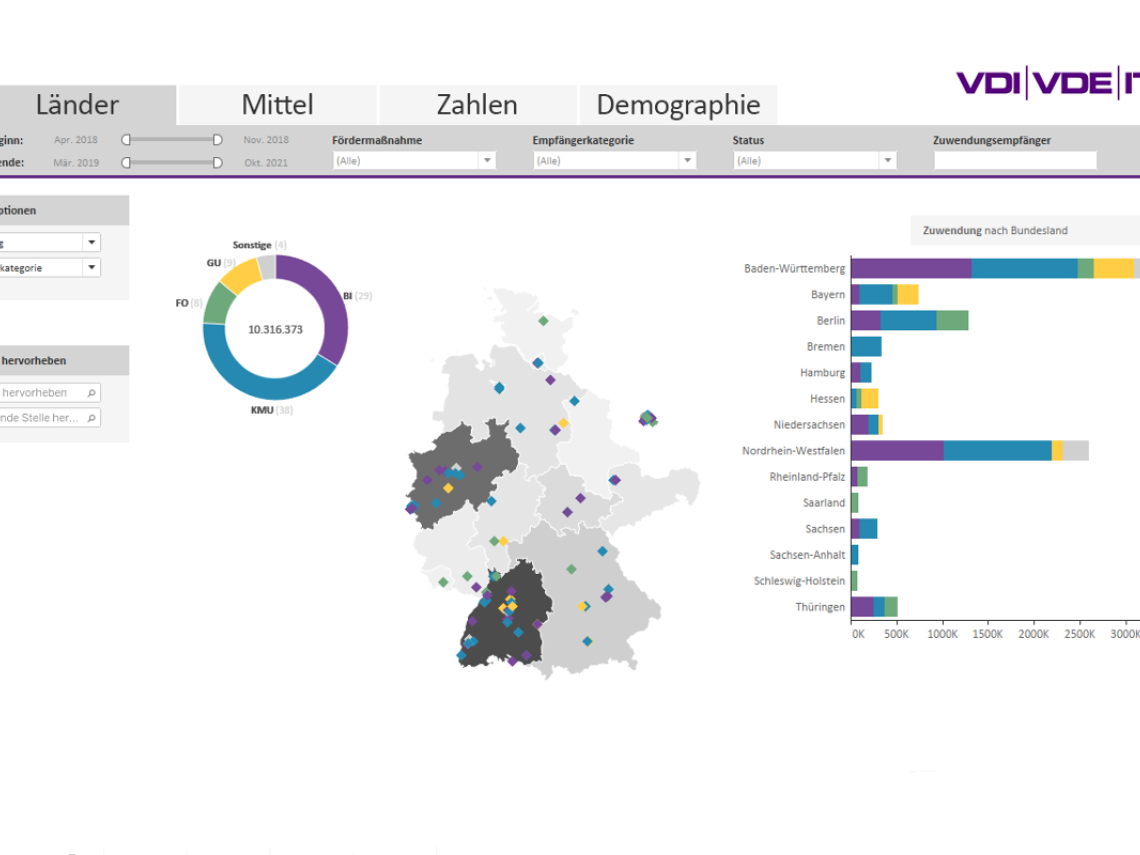
Interactive exploration of data relating to funding allows us to find quantitative answers to your questions in no time at all. The gateway for data analysis and preparation is a dashboard tailored to your questions, which provides exploratory statistical methods in a visually accessible manner.
In the dashboard we bring together, among other things, current data relating to your programme funding, combined with geographic and demographic data, in meaningful visualisations. Using dynamic filter functions, the data sets displayed can be filtered according to your requirements, to derive specific geographic and topic-based conclusions. This allows you to explore and compare key figures relevant to your various questions, in a flexible manner and with daily updated data, without the need for time-consuming, error-prone manual searches.
The visualisations in this respect are specific to the ongoing demands of project management work. They provide immediate access to ‘big picture’ distributions of key figures, such as funding total, SME involvement and outflow of funds, as well as detailed queries regarding specific projects and funding recipients.
Guided Presentations
In sessions where displays can be filtered interactively, our staff can guide you through the current approval situation, point out anomalies and create informative summaries for you to use later.
Independent Exploration
If requested, we can provide a web-based version of the dashboard. This allows you to independently view and discuss current approval data at any time.
Regular Reporting
The dashboard offers regular reporting on key visualisations. So you can always start the week with a complete picture of the current situation.
Modular Structure and Ongoing Enhancement
The fully modular nature of the tool enables other project-specific data sources to be integrated as required. The visualisations can be adapted and extended accordingly. The platform is therefore tailored precisely to your needs.
And outside the framework of any particular project, we are also enhancing the tool in the PT-Lab on an ongoing basis. This can be of benefit to you, for example, in the form of extended visualisations and opening up new data, enabling you to answer new, and more complex, questions.


